The Power of 20: Why xBratAI Uses a Rolling 20-Trade Dataset for Performance Stats
May 19, 2026The Power of 20: Why xBratAI Uses a Rolling 20-Trade Dataset for Performance Stats
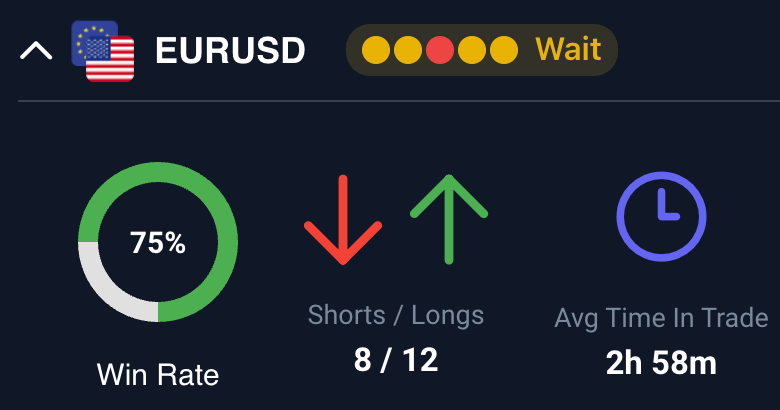
Trading is a continuous exercise in probability and risk management. To make informed decisions, you need data that accurately reflects current market conditions without being distorted by isolated anomalies. When you open the xBratAI app and look at the performance dropdowns for any given instrument, you will notice a specific design choice: we use a rolling dataset of the last 20 trades.
This is not a random number. The 20-trade rolling window is a deliberate, data-driven feature built to balance statistical significance with high market responsiveness. In a financial ecosystem where volatility shifts quickly and market regimes evolve overnight, the data you rely on must keep pace.
If you are looking to understand the mechanics behind your trading dashboard, this guide breaks down exactly why the 20-trade rolling dataset is the optimal lens for analyzing instrument performance. You will learn how it eliminates recency bias, smooths out noise, and keeps you aligned with xBratAI’s core philosophy of quality over quantity.
The Challenge of Market Data: Finding the Sweet Spot
Financial markets are never static. They cycle through distinct phases, from trending and volatile to tight, unpredictable chop. When analyzing the performance of a specific instrument, the size of your data sample completely dictates the story that data tells.
If your look-back period is too short, you react to ghosts. If your look-back period is too long, you react to history that no longer matters.
The Danger of a 5-Trade Window: Recency Bias and Noise
Imagine evaluating an instrument based on its last five trades. If three of those trades hit your stop-loss due to a sudden, unpredictable geopolitical news spike, your data will look terrible. A small sample size amplifies isolated events, creating extreme "recency bias."
When you make decisions based on five trades, you are not trading the underlying trend or the instrument's true behavior; you are trading immediate past outcomes. This leads directly to emotional decision-making. You might abandon a perfectly valid setup because of a temporary blip, or conversely, you might size up recklessly because the last five trades happened to be massive winners. Five trades are simply too noisy to form a reliable statistical baseline.
The Problem with 100+ Trades: Stale Data and Regime Changes
At the opposite end of the spectrum, why not look at the last 100 or 200 trades? While a massive sample size looks great on a spreadsheet and provides deep statistical significance, it fails in practical application for active traders.
Markets undergo regime changes. The conditions that defined an instrument 150 trades ago, interest rate environments, seasonal volume, global liquidity, might be entirely different today. A 200-trade dataset moves too slowly. It is sluggish and fails to reflect sudden shifts in behavior. If an asset transitions from a smooth parabolic trend into violent, erratic chop, a 100-trade rolling average will hide that new reality until it is too late. You will base your risk parameters on outdated market conditions.
Why 20 Trades? The Goldilocks Zone of Market Analysis
A rolling dataset of 20 trades acts as the "Goldilocks zone" for active traders. It is neither too fast nor too slow. It offers a precise, practical view of how an instrument is behaving right now, governed by three core benefits.
1. It Minimizes Noise and Smooths Outliers
Every market experiences anomalies. Large candle wicks, sudden stop hunts, or momentary liquidity vacuums can cause outlier trades. A 20-trade window is large enough to absorb these outliers. It smooths out the daily anomalies, ensuring that you analyze a true underlying trend rather than reacting blindly to a temporary spike or dip.
If two trades out of 20 are stopped out by random market chop, the remaining 18 trades still give you a clear, realistic picture of the instrument's performance profile. You get the signal without being deafened by the noise.
2. It Delivers High Responsiveness to Sudden Shifts
Compared to larger datasets, a 20-period window adapts quickly to new information. This is critical when trading futures or crypto perpetuals, where volatility can spike instantly. As older trades drop off the back of the rolling window and new trades populate the front, the dataset identifies structural changes in near real-time.
If a market enters a period of heavy consolidation, the 20-trade window will quickly reflect this new baseline. You will immediately see changes in win rates or average trade duration, allowing you to tighten your risk management or deploy different confluence requirements before capital is compromised.
3. It Provides a Robust Sample Size for Meaningful Statistics
Twenty data points provide enough weight to compute reliable summary statistics. Metrics like mean performance, standard deviation, and winner-to-loser ratios require a baseline amount of data to be mathematically valid. Twenty trades prevent your model from overfitting to isolated events while providing enough depth to trust the math. It gives you confidence that the stats you see in the dropdown are rooted in a stable, recent pattern of behavior.
Tying the Data to the xBratAI Philosophy
The 20-trade rolling dataset is not just a standalone feature; it is deeply integrated into how xBratAI views market interaction. Everything in the xBratAI Academy, from mastering trade management to handling trading psychology, relies on processing the right information at the right time.
Adapting to Chop and Volatility
Financial markets spend a massive amount of time in unpredictable chop. When markets get messy, traditional static indicators fail. By keeping your performance data restricted to a rolling 20 trades, the xBratAI app helps you quickly identify when an instrument is trapped in high-risk volatility. If the recent 20 trades show deteriorating performance, it is a clear, data-driven signal to reduce position sizing, demand higher confluence before entry, or simply sit on your hands.
Quality Over Quantity and Confluence
xBratAI is built on the principle that quality always beats quantity. We use multi-timeframe analysis and automated confluence to find high-probability setups. The rolling 20-trade dataset reinforces this. Instead of overwhelming you with years of backtested data that may no longer be relevant, the app focuses on the highest quality, most recent context. This aligns perfectly with our systematic approach: wait for the right setup, verify the current market behavior, and execute with precision.
Supporting Better Trader Psychology
Fear, greed, and FOMO (Fear of Missing Out) destroy trading accounts. These emotions usually stem from a lack of structured information. When you do not know how an instrument is currently behaving, every tick of the chart causes anxiety.
The 20-trade dropdown acts as an emotional anchor. By providing a clear, objective look at recent performance, it removes the guesswork. If you take a loss, you can look at the rolling 20 stats and realize that the broader performance profile remains intact. This builds emotional resilience and helps you maintain the routine and discipline necessary to let runners run.
Context, Not Certainty: How to View the Stats
It is crucial to understand the purpose of the performance dropdown. The rolling 20-trade dataset is designed to offer recent, relevant context. It is never a promise of future performance, nor is it meant to create a false sense of certainty.
Trading algorithms and AI models evaluate probabilities, not guarantees. An instrument that performed flawlessly over its last 20 trades can still experience a drawdown on trade 21. Markets are forward-looking and constantly evolving.
The goal of this data is to help you understand the current environment. Is the instrument respecting support and resistance? Are the trends carrying through, or are they failing quickly? By observing the rolling 20 trades, you gain a vital pulse check on the instrument's current relationship with xBratAI’s trading logic.
Practical Takeaways: Maximizing the Rolling 20 Dataset
To get the most out of the xBratAI app's performance dropdowns, you must interpret the data responsibly and integrate it directly into your daily routine. Here is how you can apply this feature to improve your execution.
1. Use Data to Scale Risk
Do not treat every instrument equally. If the 20-trade rolling data for a specific futures contract shows highly consistent, clean performance, that is a green light to trade your standard risk profile. If the data shows choppy, erratic performance with a lower win rate, immediately scale down your risk or avoid the instrument altogether until the data improves. Let the recent statistics dictate your exposure.
2. Demand Confluence
Never trade solely because a performance dropdown looks good. The rolling 20 data is one piece of the puzzle. Combine this contextual data with xBratAI’s Guardian Zones, multi-timeframe analysis, and your own structural chart reads. When recent performance aligns with high-probability confluence, you have a top-tier setup.
3. Ignore the Noise and Stick to the Process
When you encounter a frustrating loss, resist the urge to abandon your strategy. Open the dropdown and look at the rolling 20 trades. Remind yourself that one trade is statistically insignificant in the broader picture. Use the rolling data to ground your psychology, manage your frustration, and keep your focus on long-term execution rather than short-term pain.
4. Monitor for Regime Shifts
Make checking the 20-trade performance part of your daily pre-market routine. Watch for subtle shifts. If an asset that traditionally boasts high performance starts to degrade over a rolling 20-period window, it is a warning sign. The market regime is changing, and you need to adjust your tactics before a larger drawdown occurs.
Conclusion
The 20-trade rolling dataset is a powerful tool designed to cut through market noise while remaining hyper-responsive to current conditions. By eliminating the recency bias of small samples and the sluggishness of massive datasets, it provides the exact context you need to navigate modern financial markets.
Data is only as valuable as your ability to act on it. Use the performance dropdowns to understand how your instruments are behaving today, align your risk management with current realities, and execute your trading plan with unwavering discipline. Log into your xBratAI app, review the recent performance metrics on your favorite instruments, and start making contextual, data-driven decisions today.