Surviving Chop: Navigating Unpredictable Financial Markets
March 26, 2026Surviving Chop: Navigating Unpredictable Financial Markets
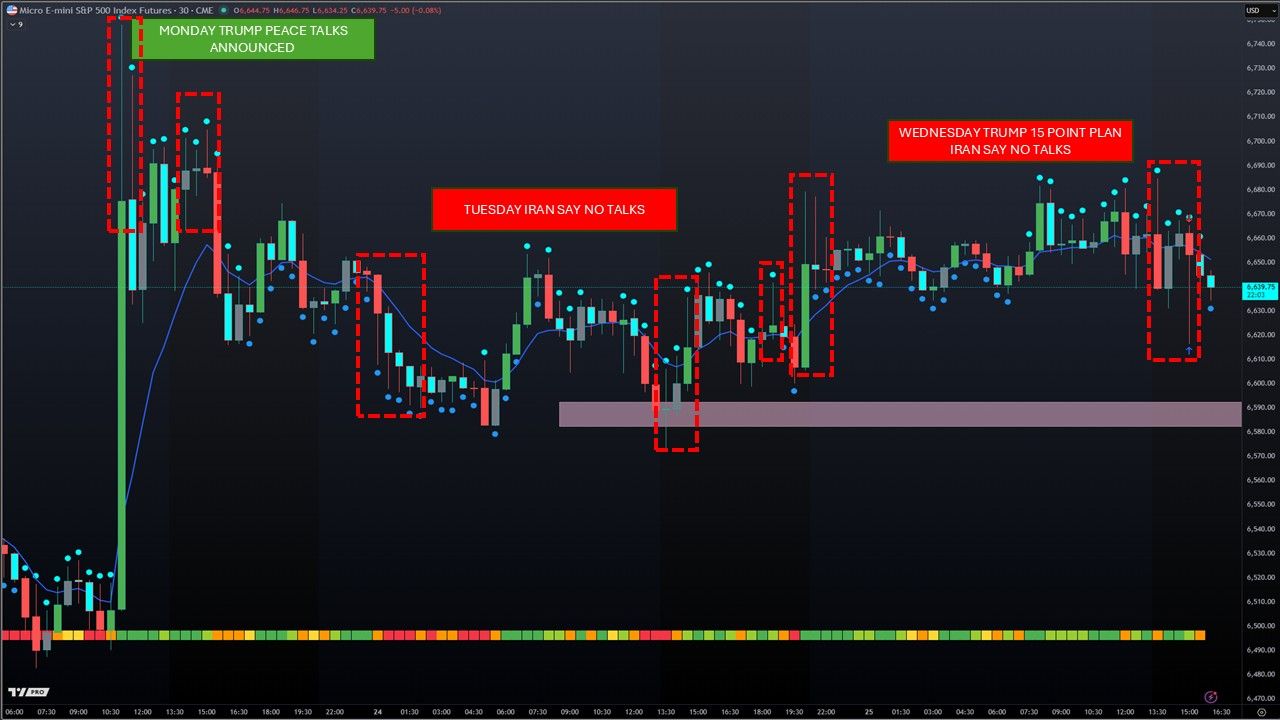
You sit down at your trading desk, load up your charts, and wait for a clear trend. Instead, the price bounces erratically up and down, hitting your stop losses without ever picking a true direction. If this sounds familiar, you have encountered market "chop." Check out the Chart for this week so far to visualize chop!
Trading in a choppy market is one of the most frustrating experiences for both new and veteran investors. Recognizing these conditions and knowing how to adjust your strategy is vital for long-term survival.
In this guide, we will explore exactly what chop is, why erratic candle wicks make it so difficult to trade, and how advanced tools like xBratAI use confluence to protect your capital during sideways price action.
What is "Chop" in Financial Markets?
Chop refers to a market condition where prices move sideways within a tight range, lacking a clear upward or downward trend. Instead of making higher highs or lower lows, the price consolidates. Buyers and sellers are locked in a stalemate, fighting over a narrow price zone.
Chop often emerges after significant news events or periods of extreme volatility, as markets try to digest new information and reassess direction. A prime example was this week's reaction to the escalation in the Iran war and high-profile statements by Mr. Trump. On Monday, markets opened with a huge candle, price surged dramatically as headlines hit, capturing everyone’s attention. But in the days that followed, instead of continuing in a clear direction, the price began to swing back and forth unpredictably. Each new comment or news alert sent the price one way, only for it to reverse minutes or hours later.
This kind of chop is common after geopolitical shocks or major announcements. The initial burst of volatility pulls traders in, but without sustained follow-through, markets settle into a state of indecision. Traders are left guessing whether to trust the breakout or brace for another swift reversal, making chop periods especially difficult to navigate.
During these periods, momentum disappears. Traditional trend-following strategies fail because the price never sustains a breakout. You might see a sudden surge in price, prompting you to buy, only for the asset to immediately reverse and trigger your stop loss.
Market chop often occurs after a massive directional move as the market digests the new price level. It can also happen during low-volume trading sessions or ahead of major economic announcements when institutional investors sit on the sidelines.
Why Choppy Markets Destroy Trading Accounts
Trading thrives on directional movement. When markets chop, the mathematical advantage shifts away from the trader.
First, the reward-to-risk ratio shrinks drastically. Because the price is stuck in a tight range, your potential profit targets become much smaller. Meanwhile, your risk remains the same, forcing you to take setups that do not justify the potential downside.
Second, choppy markets trigger emotional trading. Repeatedly getting stopped out leads to frustration, "revenge trading," and over-leveraging. The lack of a clear trend tempts traders to force setups that simply do not exist.
The Danger of Large Candle Wicks
If you look at a candlestick chart during a choppy period, you will often see long wicks extending far above and below the candle bodies. These wicks represent severe intraday price rejection and extreme volatility without actual progression.
Large candle wicks create massive unpredictability. A long upper wick might look like a breakout, tricking retail traders into entering long positions. Within minutes, institutional algorithms fade the move, pushing the price back down and leaving buyers trapped.
These rapid directional changes create a "whipsaw" effect. You get thrown around by false breakouts and fake breakdowns. Because the wicks sweep liquidity above and below the consolidation zone, they hunt stop losses with brutal efficiency. Predicting short-term direction becomes nearly impossible.
How xBratAI Handles Market Noise
To survive market chop, you need a system that filters out the noise. This is where xBratAI steps in. xBratAI relies on the concept of "confluence" to generate trading signals.
Confluence occurs when multiple technical indicators, price action setups, and algorithms align to confirm a single trading hypothesis. For example, if momentum oscillators, volume profiles, and trend indicators all point upward, you have high confluence.
In a choppy market, confluence disappears. Moving averages flatten out. Oscillators cross back and forth aimlessly. Volume drops. The data becomes highly contradictory.
Why Fewer Signals Mean Better Protection
Many traders worry when their automated systems or AI tools stop firing signals. However, when xBratAI AI stays quiet, it is doing exactly what it was designed to do: protect your capital.
Because xBratAI AI requires strict confluence to validate a setup, it intentionally filters out sideways, unpredictable price action. The erratic candle wicks and false breakouts fail the AI's rigorous validation checks.
The AI recognizes the conflicting data points that define market chop. Instead of guessing the direction of the next unpredictable wick, it waits for the market to establish a clear, dominant trend. By firing fewer signals, xBratAI AI prevents you from suffering the death by a thousand cuts that chops up so many retail accounts.
Master Your Trading Patience
Understanding market chop completely changes how you approach trading. Sideways markets are not opportunities to force profits; they are times to practice patience and preserve capital.
When the charts fill with large, unpredictable candle wicks, step back. Recognize that capital preservation is a core trading strategy. Trust systems like xBratAI that prioritize high-probability confluence over continuous, risky action.
By learning to identify chop and wait for proper alignment, you position yourself to capture massive gains when the real trend finally emerges. Keep your powder dry, let the AI filter the noise, and wait for the market to show its true hand. This is a small period in a traders Quarter or Year.
As Chop decreases xBratAI starts to probe
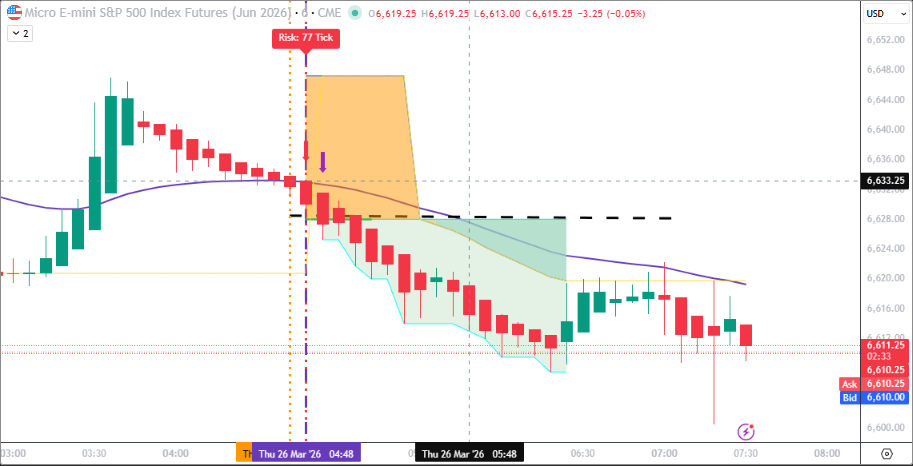
Continuing into the week, as the Chop Index starts to reduce, we witnessed confluences starting to emerge overnight on Wednesday and into Thursday morning. And so, the xBratAI system identified and started to probe with confluence setups. The chart below shows one of the winning trades taken by the App on MES.
This probing happened whilst keeping risk to a minimum with some small losers and then winners, as can be seen from the screenshot below of the trade performance data on the admin panel for the xBratAI Team below.
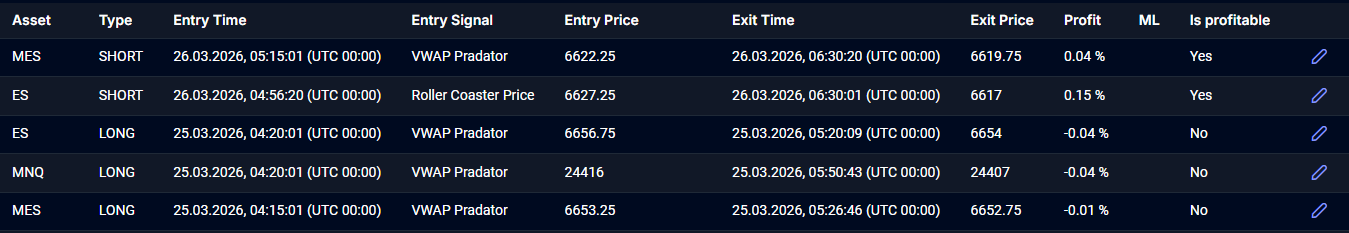
MES - Short: +10 ticks
ES - Short: +41 Ticks
ES - Long: -11 Ticks
MNQ - Long: -36 Ticks
MES - Long: -2 Ticks
Total Tick move = +2 Ticks Profit (Essentially Breakeven)
Shorts outperformed longs, longs were just late entry.
So, we are still not out of the Chop yet, but we can see it is calming down and confluences are starting to form again. Aggressive trade management and stringent risk management are a priority for the xBratAI system to cope with the chop during this time, but it is learning all the time and crunching to data to find the new groove for confluence.